


After getting some advice from a friend, I’m going to move my Glúnta Research updates onto my main Substack. Apparently I don’t need to run two, but I can create a ‘section’ - we learn something new every day! Sorry if this duplicates things for you - I appreciate your patience as I get to grips with this!
When I first began gathering church data for Glúnta Research, I thought the work would be mostly about finding names and locations. That was naive, though perhaps usefully naive, because if I had known how much detail would be involved I might have found a more sensible hobby! The early task sounded straightforward enough: find the churches, put them in a spreadsheet, add coordinates, and place them on a map. In practice, it meant working through denominational directories, church websites, public social media pages, old Google listings, half-updated Facebook profiles, and the occasional church that appeared to be some sort of secret organisation!
The first version of the map was useful because it made the data visible, it allowed me to start to notice things that I perhaps already sort of knew. Patterns appear that can get lost in the data of a spreadsheet. Clusters become a bit more obvious, and empty spaces, well, empty. A dot in the wrong place on a map feels less like a harmless error and more like something that needs fixing, especially when the whole point of the project is to understand where visible Gospel witness actually exists.
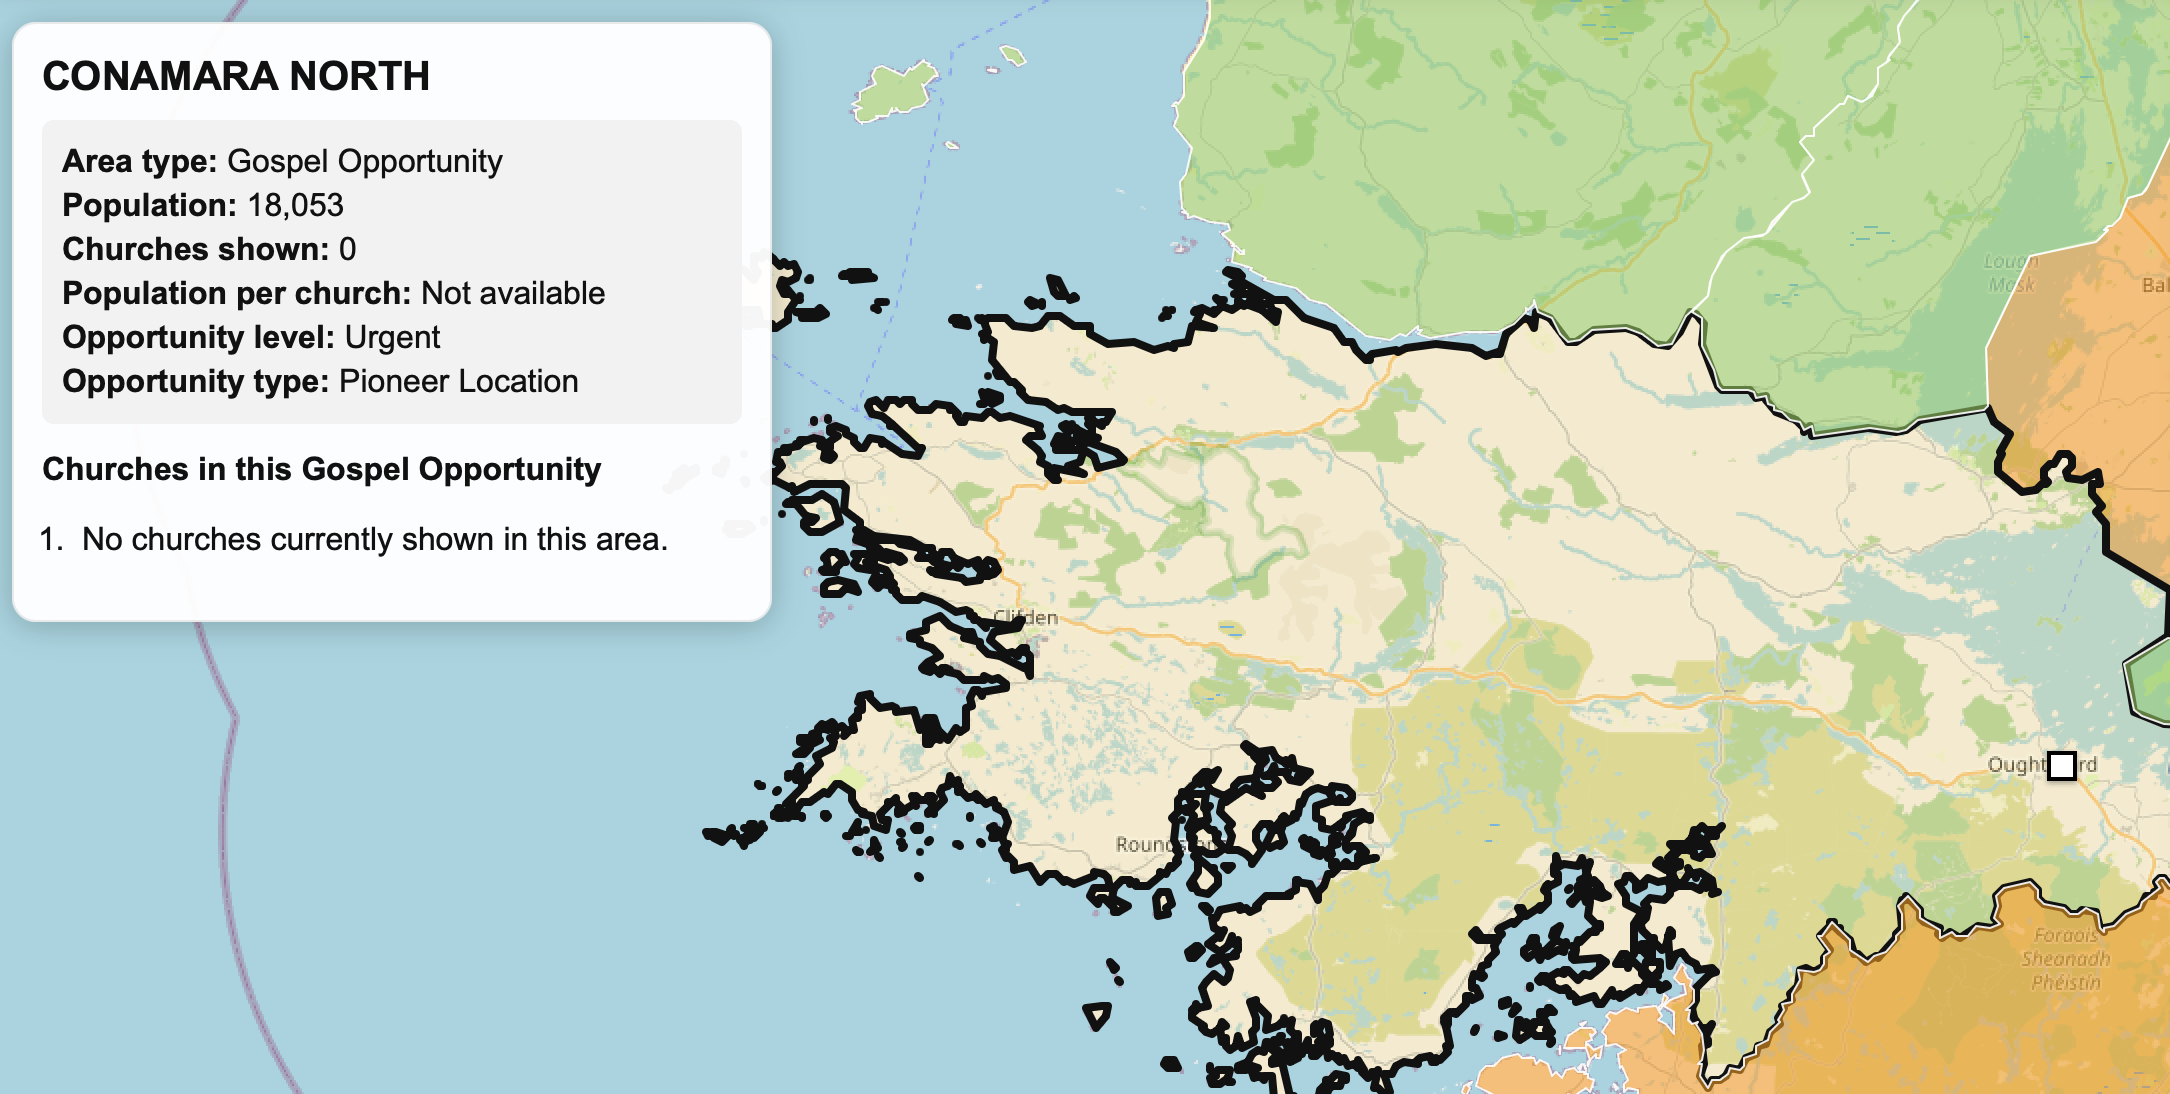
But a visible map was not enough. I needed something that could be tweaked and filtered. I wanted to move beyond simply displaying church points and begin asking more meaningful questions of the data. What happens when you click a county? What churches are actually inside that boundary? What does the population look like in relation to the number of churches? How does the picture change when you filter by denomination or broader tradition? What happens when you look at this from a planting or missiological perspective, and what information would I want to see?
That is where the project began to change shape, and the work began to exponentially increase! The map moved from a hosted mapping platform into a custom build using CSV files, and GeoJSON boundaries. If that sounds confusing to you, welcome to my world! Using those names sounds more impressive than it felt at the time, or even how it still feels. Mostly it involved learning enough code to break things in new and creative ways, torturing my friend for his help and understanding (thanks Seth!), then trying to understand why the map had stopped doing what it had done ten minutes earlier. I have broken this thing about 45 times, and it still gives me palpitations each time I click ‘publish’! Still, the move was worth it because it gave the project more control, more transparency, and more room to grow.
The basic structure is now fairly simple. Each church sits in a core dataset with public information: name, public meeting location, county, website where available, denomination or affiliation, broader tradition, and coordinates. Around that are geographic layers, including counties, Local Electoral Areas, urban zones, and population data. Once those pieces began to work together, the map started becoming a research tool. A static map lets us look at information. An interactive map lets us investigate. We can search for a church or town. We can isolate a denomination or network. We can click a county and see a local profile. We can compare visible church presence with population. At least until I break it again!
This is still not a finished project. Church data is awkward because churches are living communities and we aren’t always good at making ourselves “findable”. Churches move buildings, change names, update websites, forget to update websites, have three websites, begin quietly, close quietly, merge, restart, and sometimes leave behind a confusing digital trail. Some churches are easy to find online. Others are active but almost invisible unless you already know someone connected to them. Public data gives us a starting point, but it does not remove the need for local knowledge.
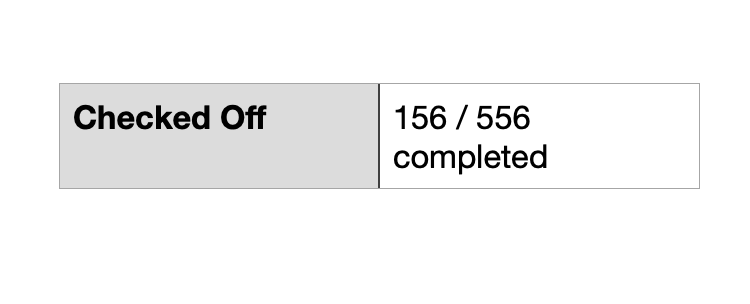
That is why the map will launch publicly on Friday 29th May as a tool to be used, questioned, corrected, and strengthened. I am not releasing it because every entry is fully accurate - I’m currently 156/556 in terms of checking! Pray for me! But I am releasing it at the end of the month because it is now useful enough to help us see, and because making it public is the next step in making it better.
My hope is that the Glúnta Church Map will serve denominations, networks, pastors, church planters, mission partners, and ordinary Christians who care about the future of Gospel witness in Ireland. I want people to look at their own county, their own network, their own town, and the places they have not thought about for years. I want the map to provoke better questions, not merely produce a colourful picture of dots and areas.
But please hear me when I say this: A map will not plant churches or disciple believers. It will not strengthen a tired pastor and his wife, or give courage to a small congregation. But it may help us notice where encouragement, prayer, partnership, or new Gospel work is needed. And once we begin to see those places more clearly, we may find it harder to keep speaking about Ireland only in general terms. I’m not that excited about this stage, as exciting as it will be when I click ‘confirm’ to the last data update. I’m excited about what’s next. This map was never meant to show us how to tell stories of “unreached Ireland” but to help us collaborate into supporting one another to see healthy and sustainable churches planted and established, as well as supporting those who are working in them.
The full interactive map launches on Friday 29th May. Before then, I’ll share more about how people can collaborate on the data, and then I’ll release a short video walkthrough showing how the map works.
For now, the spreadsheet has become a map. A map that I fiddle about with and break on an almost daily basis, but a map I’m excited for you all to see. As long as you don’t break it too!
If you have any questions at all about the research, I’d love to chat, or answer them if I can. Also, if you want to help me check church data for the following counties, please get in touch!
Monaghan
Cork
Donegal
Dublin